
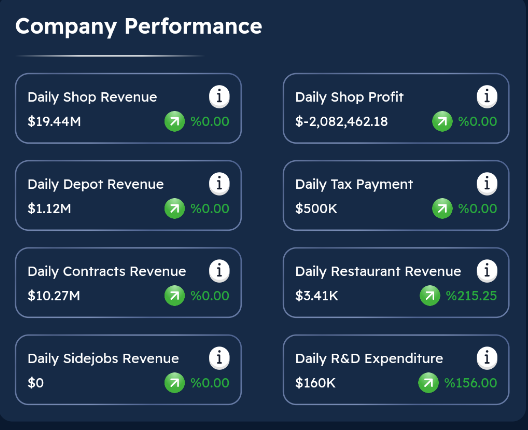
Company Performance screen displays your company's key financial data compared to the previous day.
The green or red percentage value on each card shows how much the relevant statistic has increased or decreased compared to the previous day. This way, you can easily track your company's daily performance.
Performance Indicators
Daily Shop Revenue
Shows the total sales revenue your stores generated in a single day.
Daily Shop Profit
Shows the net profit your stores earned after all revenues and expenses have been calculated.
Daily Warehouse Revenue
Shows the daily total revenue from sales made through the Logistics Warehouse.
Daily Tax Payment
Shows the total tax amount you paid during the day.
Daily Contract Revenue
Shows the total revenue from completed contracts.
Daily Restaurant Revenue
Shows the total revenue your restaurants earned in a day.
Daily Side Jobs Revenue
Shows the daily total revenue from the side jobs section.
Daily R&D Expense
Shows the total cash amount you spent during the day for R&D research.
Important Information About Daily Shop Profit
Shows the net profit your stores earn after all income and expenses are calculated. If a loss is made by the end of the day, the value is displayed as minus (-).
What Do Percentage Values Mean?
The percentage value in the bottom right of each card shows the rate of change compared to the previous day for the relevant data.
Green value: Indicates an increase compared to the previous day.
Red value: Indicates a decrease compared to the previous day.
%0,00: Shows no change compared to the previous day.